Canvas page in Power App - additional code-free charts
I was working on a project where I needed to add a radar chart into a canvas page in a Power App. I found a handful of options, but settled on this one for a handful of reasons:
- Makes use of canvas components
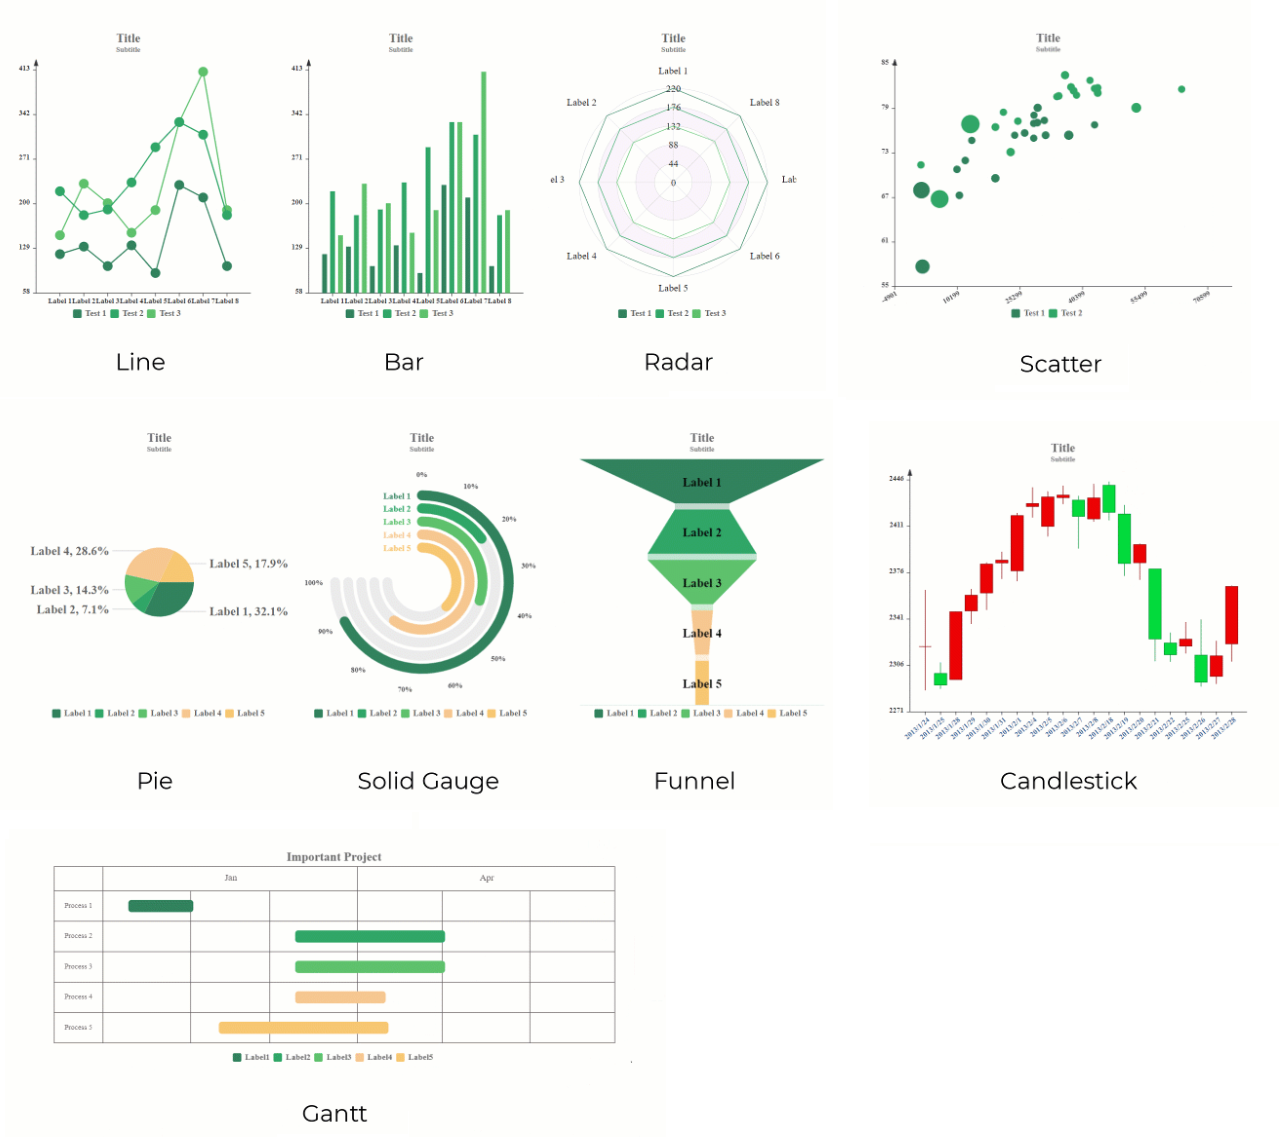
- Single component provides several chart options
- Easy-to-update properties
- Good sample data included in the app
There were some quirks in working with it, but no show-stoppers for a simple MVP. I may fork the repo and suggest some updates, but it’s valuable as-is.
Original blog/announcement
While I was searching around, I found several radar chart options, but the blog for this one gave me the most confidence that I’d be able to use it straight-away. Sure it’s from a couple of years ago, but it’s still a really valuable starting point.
Deployment details are on GitHub
I ended up popping through to the GitHub site. I probably wouldn’t have gone for it except for the strong documentation around each chart type in the /docs folder.
GitHub - OGcanviz/ChartComponents: SVG chart components for Microsoft Power Apps.
SVG chart components for Microsoft Power Apps. Contribute to OGcanviz/ChartComponents development by creating an account on GitHub.
 OGcanviz